85% QOQ increase in revenue from site search users
Conversion
28% YOY increase in site search conversion rate
The Performance Success Story
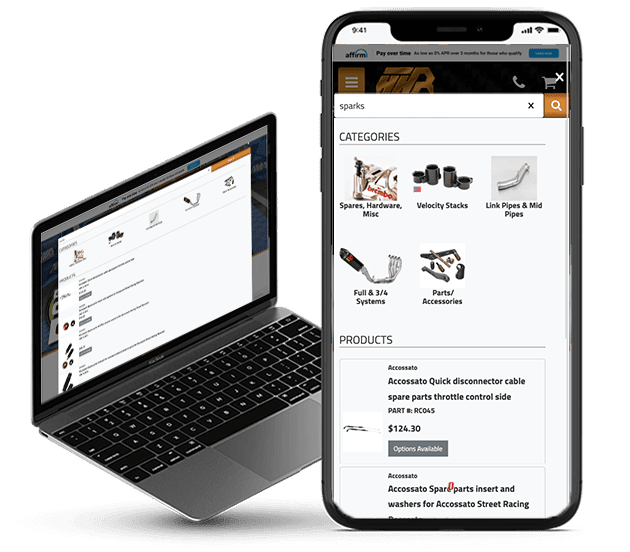
Pace Performance carries parts, accessories and performance components for every General Motors automotive need. The client is primarily a brick-and-mortar dealership with a secondary online retail site that brings in extra business.
Challenge:
Initially, the client did not seek out website improvements. However, they saw a demo of our new PartsLogic site search while at a large industry convention (SEMA) in the fall of 2021. The client was skeptical at first but decided on a three-month trial of PartsLogic site search in hopes of updating their existing on site search with a more helpful user experience. The client also hoped to grow past a revenue plateau
Solution:
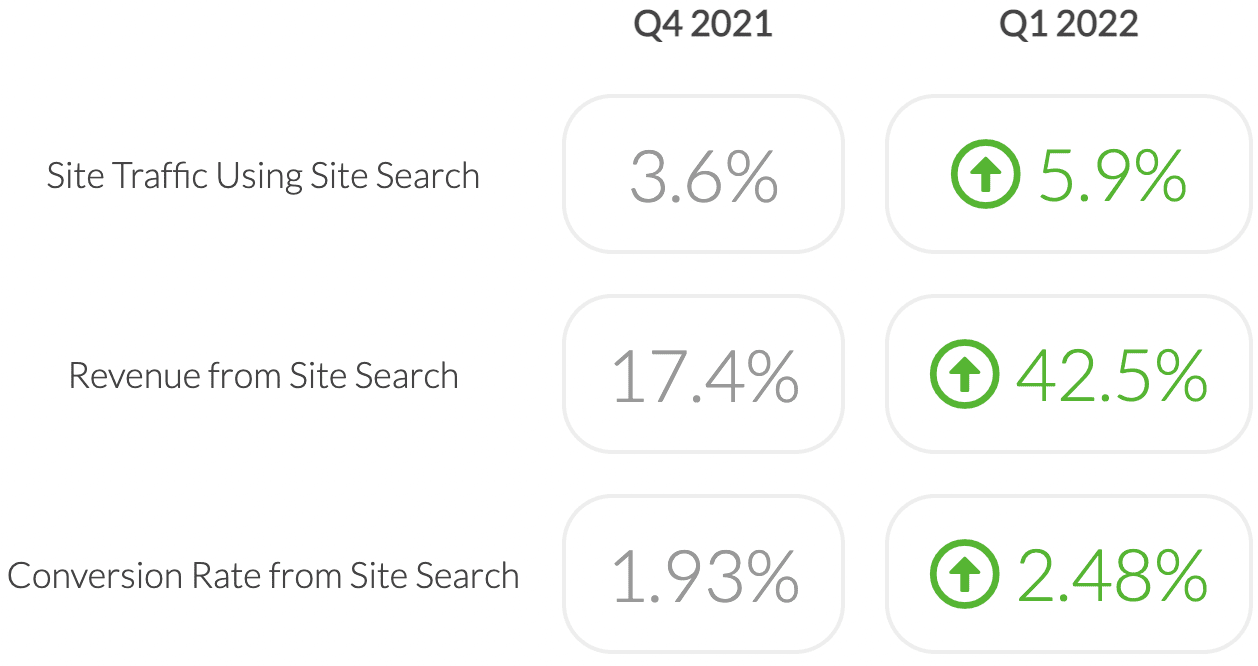
After a three-month trial period of PartsLogic site search, the client saw an exponential increase in revenue from site visitors utilizing the new site search. Data also shows that, as of the first full quarter in use (Q1 2022), the 6% of site traffic that uses the new search drives nearly half (42.5%) of all revenue. When compared to the 17.4% of revenue it drove the previous quarter (Q4 2022), this is roughly an 83% difference.
The success of these results have turned the client into a long-term PartsLogic supporter.
Supporting Data
The client launched PartsLogic on its site November 23, 2021.
In looking at the client data for the quarter in which PartsLogic was launched (Q4 2021), as well as the following quarter (Q1 2022) and its year-over-year counterpart (Q1 2021), it’s clear that PartsLogic not only fosters more engaged visitors, but these visitors drive a significant percentage of the company’s overall online revenue.
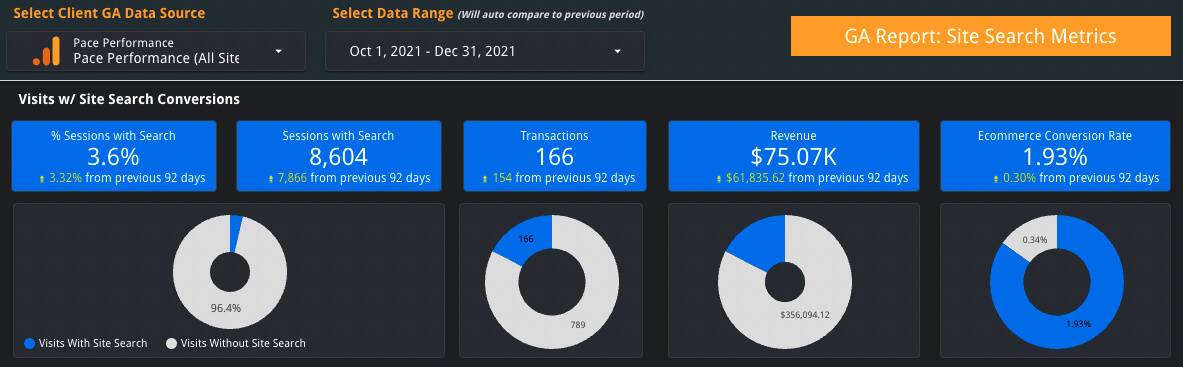
Q4 2021 (Oct. 1 - Dec. 31, 2021)
The client launched PartsLogic on its site November 23, 2021.
In looking at the client data for the quarter in which PartsLogic was launched (Q4 2021), as well as the following quarter (Q1 2022) and its year-over-year counterpart (Q1 2021), it’s clear that PartsLogic not only fosters more engaged visitors, but these visitors drive a significant percentage of the company’s overall online revenue.
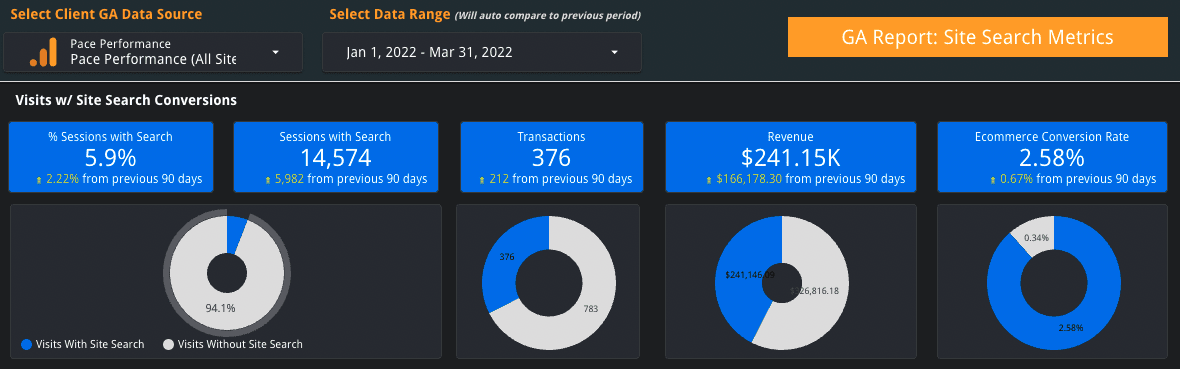
The blue on each pie chart indicates “with site search” and the gray indicates “without site search.”
Once PartsLogic launched, site traffic using on-site search remained the same but revenue and conversion rate has seen steady, continual increases.
Q4 2021 (Oct. 1 - Dec. 31, 2021)
When comparing the launch quarter (Q4 2021) to the following quarter (Q1 2022), site trafficking using site search remained steady, but revenue and conversion rates from site search alone saw sharp increases.
Quarter-over-quarter, this amounts to an 83% increase in revenue and a 28% increase in conversion rate.
Q1 2022 (Jan. 1 - March 31, 2022)
In looking at the client data for the quarter in which PartsLogic was launched (Q4 2021), as well as the following quarter (Q1 2022) and its year-over-year counterpart (Q1 2021), it’s clear that PartsLogic not only fosters more engaged visitors, but these visitors drive a significant percentage of the company’s overall online revenue.
Overall, adding PartsLogic site search to the client’s site has allowed the company to foster engagement with its customers and grow past its revenue plateau. Improving site search was a cost-effective solution to improve sales without increasing ad spend and site traffic.
Request A Demo
Curious how PartsLogic can help you? Request a demo! We’ll walk you through it and show how it can benefit your business.